Behind solar activity cause
Introduction
The aim of the following treatise is to show some possible correlations between the motion of the planets and the observed solar activity. We assume, as already at the very beginning of systematic observation in the 18th century Rudolf Wolf, that the main engine of action is the planet Jupiter, and that the influence of this planet is further combined with the action of the other planets, with outer planets deciding the longer cycles. Among these, Saturn potentially has the greatest influence, which was indicated by the English mathematician and astronomer E.W.Brown in 1900 and which later (in 1930) the American mathematician (of Irish origin) W.A.Luby tried to prove.
Other planets and bodies also participate in the actual course of the cycle, while the movement of the more distant ones is reflected in secondary (secular) cycles of activity and smaller and closer to the Sun planets modify the course of the cycle only in short time intervals and can participate at most at some local extremes of activity. If the correspondence of the movement of the planets close to the Sun with the primary Wolf cycle of activity is observed, we consider it rather the result of the synchronization of all the bodies of the system - which occurs necessarily because the Sun tries to minimize its movement around the center of gravity (barycenter) of all bodies that orbit around it, and also as a result of the "repulsion" of bodies on nearby orbits, which gives rise to resonances.
We take some initial considerations from Czech theorists - I.Charvátová (ordered and chaotic periods of activity) and P.Kalenda (action of bodies on elliptical orbits). We further confirm the correctness of the presented relationships by the fact that they cover the ideas of other researchers - e.g. the Finnish climatologist Timo Niroma (effect of Jupiter at perihelion) and the Australian climatologist Ian Wilson (the action of the planets in quadratures). We will draw attention to potential connections with the works of other scientists later in the text.
In the text, we will also try to deal with objections against the planetary theory of solar activity. Some objections are difficult to counter, but, for example, G.F. Kronenberger's criticism from 1913 can be - on the basis of the presented relationships - refuted relatively easily. At the same time, we will also show situations or periods that we cannot explain with the presented relationships.
The basic idea in our treatise is the idea that Solar activity is the product of multiple events that do not always fit together perfectly, but - for reasons not yet fully known - alternately come to the fore or retreat. We show two functions with close periods which they are derived directly from the movement of the bodies Jupiter and Saturn and correspond to the relationships designed by E.W. Brown in 1900 and recently revived by the American scientist (of Serbian origin) M.A.Vukcevic.
Comparing the proposed functions with phenomena observed on Earth revealed a remarkable correspondence between the minima of the functions and larger geologic events on Earth. This dependence will need to be documented statistically, which is not the subject of our work, but in some cases it seems absolutely obvious. Major geological events (volcanic eruptions, earthquakes) occur frequently appear in a short time interval after a conjunction or opposition Jupiter with Saturn near Jupiter's perihelion. Such an arrangement occurs approximately with a period of 60-61 years, due to the closeness of the periods of both functions, however, can appear very approximately even about ten years earlier or later (from exact alignment). This dependence is followed similarly not only by geological but also by climatic factors and potentially geomagnetic phenomena - e.g. storms observed at sea in 1099, 1526, and 1953, as will be shown in the paragraphs on Babylon period (427 years = 7 * 61 years).
Influence of planets on the Sun
Action factors
Negative factors
Conjunctions (sometimes also oppositions) of distant large planets are usually counted among the phenomena that reduce solar activity. Because conjunctions not only increase strength towards the Sun, but they also deviate the position of the Sun relative to the barycenter, this deviation and thus the irregularity of movement in the solar system is sometimes considered to be the cause of the decrease in activity (I. Charvátová).
If we extend the phenomenon of conjunction to more bodies, we speak of directional "thickening". The action of several bodies in one particular sector can have a greater effect than a simple conjunction. Such thickening can increase in certain periods in parallel with how the bodies gradually (from distant towards the Sun closer ones) come into mutual conjunctions.
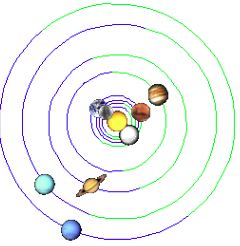
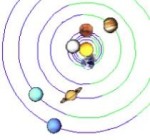
In the vicinity of the year 1306 when the outer planets (J-S-U-N) meet in a relatively narrow sector there was (e.g. according to Schove) lower solar activity and the entire wider area tends to be called Wolf's minimum (in the picture the position of the planets on 15.8.1306).
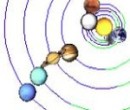
And similarly - the year 1810 is considered a year without activity. Practically no sunspot was observed this year. Its wider surroundings are called the Dalton minimum. It follows about 504 years after 1306, which is, among other things, the time with which the planets Saturn, Uranus and Neptune - along with Pluto- approximately repeat the positions.
There is one more thing added to the mentioned factors which has essential for our further considerations: An effect similar to the conjunction of the planets can be produced even by a single body in an elliptical orbit, the approach of a body to perihelion is analogous to a conjunction with another body (P. Kalenda).
Positive factors
Positive factors are the inversion of negative factors. The most prominent of them are the so-called quadrature of the planets, that is, the moments when the P-o-Q angle (where P,Q are the planets and "o" represents the Sun) is right.
P.R. Romanchuk (Kiev University) included the quadrature of the planets in the calculations of extremes of activity already in the 60s of 20th century. Then in the next decade in joint work H.T.Mörth (England) and L.Schlamminger (Germany). Later, the importance of quadratures was also pointed out by Ian R.G. Wilson.
In the Mörth-Schlamminger theory, quadratures of Jupiter-Saturn and Uranus-Neptune pairs are mainly considered. The distance between the first of them amounts to an average of 19.86/2 = 9.93 years, the distances of the others average 171.4/2 = 85.7 years. The actual spacing of the squares regularly deviates from the average spacing, for Jupiter-Saturn squares in cycles with an approximately 60-year period.
However important the phenomenon of quadratures seems to be, it is not possible to explain the entire continuum period. Explaining that the phenomenon of quadratures is more complex and is, for example, more complex dependence of the goniometric functions of the motion of the planets, or that it is affected by modulation, etc. could not be confirmed in any way.
According to the location of the bodies, we can distinguish two types of quadratures:
-
1. Before the conjunction of bodies (faster body behind),
for J-S e.g. 1778, 1837, 1958, for U-N, 1778, 1947, 1958. -
2. After the conjunction of bodies (faster body in front),
for J-S e.g. 1727, 1947, for U-N 1870.
The mentioned action of elliptical orbits also seems to be a potentially significant phenomenon. In some periods, higher solar activity correlates with the movement of planets near the aphelions. As here in the period approx. 1940-1985 extremes (1947.5, 1957.9, 1968.9, 1979.0) at the aphelions of Jupiter (1945.93, 1957.81, 1969.67, 1981.58):
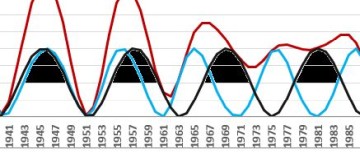
After 1750 or in 1940 quadratures disappear (become inaccurate). At the same time, however, the period of increased influence of Jupiter's elliptical orbit begins!?
For the period 1700-1980, the general rule is that in the vicinity of Uranus-Neptune oppositions (1710-1750, 1890-1940) solar activity is governed by Jupiter-Saturn squares, around the conjunctions (1770-1830, 1950-1980) then the aphelion of Jupiter. However, the same rule does not seem to apply to other periods.
Gnevyshev gap
Gnevyshev showed that the maximum (in the green line 5303 Å) around 1958 there were two - the first in 1957, the second 2-3 years later. Time interval between these two dates is called the Gnevyshev gap. According to the functions introduced above, we also get in this cycle two maxima - but somewhat earlier: the maxima from the Jupiter-Saturn quadrature in 1955.98 and the maximum since the aphelion of Jupiter in 1957.81. This is the last time named corresponds to the first Gnevyshev maxim. Gnevyshev's second maximum it occurs rather at the moment of the Jupiter-Saturn conjunction. The Uranus-Neptune quadrature (approx. 1955.3) is also projected into the entire interval.
Effect of Jupiter-Saturn squares
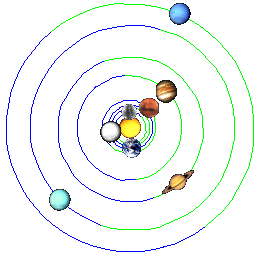
The high extremes of solar activity in 1727 and 1837 are closely preceded by Jupiter-Saturn quadrature (1727.50-1727.39=0.11 years, 1837.20-1836.99=0.21 years).
29.6.1727
 11.03.1837
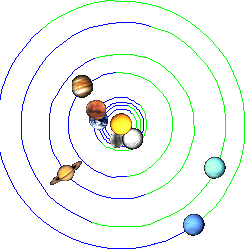
Extremes occur in the period 1900-1940 (1907.0, 1917.6, 1928.4, 1937.4), approximately in quadrature (1905.82, 1916.36, 1926.65, 1936.07):
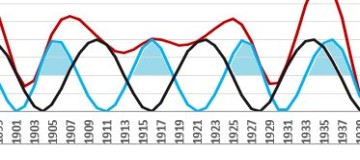
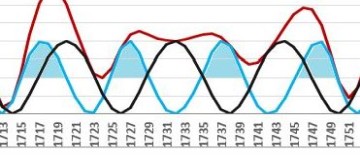
The same thing happens in the period 1710-1750. Cycles of solar activity here progress almost synchronous with Jupiter-Saturn cycles with extremes (1718.2, 1727.5, 1738.7, 1750.3) in squares (1717.70, 1727.25, 1737.57, 1748.06):
In the data of extremes of solar activity, according to Schove, the solar cycles progress synchronously with quadratures in periods: 10-40, 120-150, 195-240, 385-430, 555-605, 655-675, 715-765, 960-1005, 1150-1200, 1360-1400, 1430-1460, 1515-1560, 1715-1750, 1885-1950.
The action of Jupiter in the aphelion
Some older (historical) records also coincide with the year of Jupiter's aphelion about observed sunspots - e.g. from 807 (aphelion 807.1), 829 (830.83), 1198 (1198.64).
In the data of extremes of solar activity, according to Schove, the solar cycles progress synchronously with the aphelion of Jupiter in the periods: 95-155, 330-360, 440-465, 500-570, 710-750, 805-830, 925-1000, 1130-1190, 1350-1360, 1400-1415, 1515-1530, 1610-1625, 1775-1830, 1955-1980.
Combination of influences
In the period 1750-1820, the effect of elliptical orbits does not seem to act independently. It consists of the effect of Jupiter-Saturn squares!?:
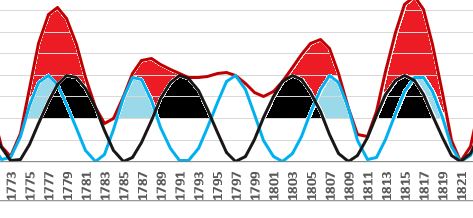
Missing maximum!?
The previous image shows one remarkable thing. By combining both observed influences to extremes around 1787 (max 1788.1) and in 1807 (max 1805.2) one cycle of squares remained - with an extreme near the year 1797 free - as if not covered by solar activity. This is also evident from the following table:
Jupiter in aphelus Extreme activity Quadrature S-S
-------------------------------------------------- --
1791.73 1788.1 1786.20,
- - 1797.18
1803.61 1805.5 1807.58
|
The position of the planets at the beginning of 1797 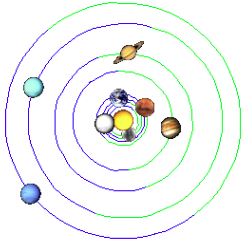
|
And it is precisely the year 1797 (or 1796-1797), whose correct classification are conducted among polemic scientists. Does it contain the (originally omitted) maximum of the activity curve or not? The behavior of the observed 22-year Hale cycle is shown here (compared to other periods) deviations and there is a violation of the Gnevyšev-Ohl rule.
From the above graph, we can see that in 1797 there is a maximum of quadratures, but it is weakened - it is not like the period before and after it enhanced by the aphelion of Jupiter. Around 1797, not only Jupiter, but also Saturn and Uranus are near perihelion.
We can find a similar type of extremes as in the years 1788 and 1805, for example 1718, 1848, 1907 and a similar type of extreme as in 1797 emerges for the years 1857, 1916 (occurred 1917.6) and 1975.
The increase in activity in the period 1760-1780 or 1940-1960 is potentially strengthened Uranus-Neptune squares. At the same time, the turning points in the vicinity of 1762 or in 1941 correspond to Jupiter-Saturn-Uranus conjunctions.
Therefore, solar activity does not have to be the result of one type of action, but perhaps by alternating several such, accordingly, how the positions of the planets change over time. At different times, different manifestations gain more or less strength, they show their influence and then disappear again.
We will look at the manifestations of this common essence in a little more detail.
Self functions
All the above-mentioned factors of action are based on the same basis: an increase in the gravitational influence on the Sun (over a period of time) generally leads to decrease activity, releasing this influence increases activity.
How do we derive the functions that show up in the graphs? The black curve has the average period of Jupiter's orbit: J=11.862 and the blue curve half period of Jupiter-Saturn conjunctions: (J,S)/2 = 19.86/2 = 9.93 years.
Jupiter's perihelion transits are fairly regular, but the conjunction distances changes - due to the movement of the planets in elliptical orbits. More precisely, we have to calculate the function points gradually - from the current positions of the planets. At each moment we define the longitude difference of Jupiter and Saturn (dJS) and the difference between the longitude of Jupiter and Jupiter's perihelion (dJp):
              dJS = (Ls - Lj)/2;
              dJp = Lj - Ljp;
|
Then we calculate the function values. We distinguish basic and alternative functions:
| Basic functions | Alternative functions |
| var sJS = -Angles.Cosin(dJS); var sJp = -Angles.Cosin(dJp); | var sJS = Math.Abs(Angles.Sinus(dJS/2)); var sJp = Math.Abs(Angles.Sinus(dJp/2)); |
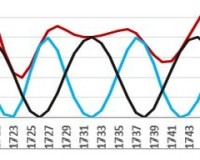
|

|
Function Composition
The proximity of the lengths of the mentioned two periods (9.93 and 11.86 years) allows that in some periods cycles can run in parallel and reinforce each other. In other periods, one of the factors prevails over the other, or they combine with each other.
Periods with lengths of 9.93 years and 11.86 years form shocks with a period of (9.93, 11.86) = 61 years and the internal period [J,S] = [9.93, 11.86] = 2*5.40 = 10.80 years. In a completely analogous way, E.W.Brown proposed functions in 1900, which from the movement of Jupiter with Saturn he derived the period (J,(J,S)/2) = 61 years. Again this is an average period, in fact the length varies according to the position of the planets Jupiter and Saturn in elliptical orbits.
In the following picture, we see the approximately 60-year interval 1885-1945. Middle parts - where functions come into antiphase - we call it a "transitional period".
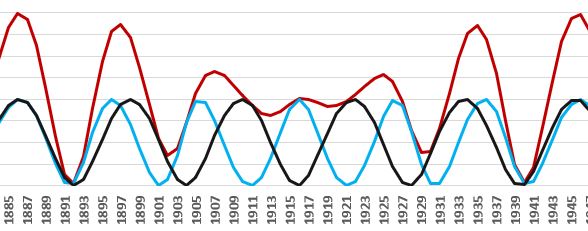
The solar cycle period of 10.8 years is often stated (often without much justification) in various theories, although it does not correspond to the period calculated from the known cycles, which comes out rather a little bigger - around 11.05 years (while including uncertainty in some extremes - e.g. in the cycle around 1797, as we saw above...). E.g. Peter Jakubowski calculated in the Naturics model from 1998 the length of the period to approx. 10.81254 years. The value of 10,807 years comes from the resonance (3/2J-1/S) and the Bretagnon periods.
With twice the cycle periods, i.e. (J,S) = 19,859 years and 2J = 23,724 years works in his work (from 2004) Milivoj A. Vukcevic. But here it is difficult to justify the meaning of period 2J (as we mentioned elsewhere - in the treatise on Envelope functions).
The orbital periods of the centaurs Pholus and Nessus are 91.79 years and 122.3 years. These periods are approximately in the ratio of 4:3, where 91.79 years * 2/3 = 61.19 years and 122.3/2 = 61.15 years.
Cycle length
The observed bipolarity of the cycle length of solar activity also seems to correspond to the double length of the primary cycles - the most frequently occurring cycle lengths are divided into 2 groups (I. approx. 10 years, II. approx. 12 years).
The first of the periods was derived not only by Heinrich Schwabe (1789-1875) from records of sunspots, but also Karel Václev Zenger (1830-1908) from well-known volcanic eruptions. Other observers later also pointed out the roughly ten-year period of various phenomena. Edward R. Dewey (1895–1978) leans more toward a lower period (9.6 years), T.W.Cole higher (10.45 years). Clément Juglar (1819-1905) determined the duration economic cycles for 10 years. In the period 1780-1865, the Etna volcano erupted in 1780, 1792-93, 1802, 1809, 1811-1812, 1819, 1832, 1843, 1852-53, 1865.
Average period
If effects with average periods (J,S)/2=9.93 and J=11.86 years alternated evenly, the average period of the solar cycle would be approximately 10.9 years. Note, however, that the length measured between minima is uncertain, because the minima have different depth and duration (I.Usoskín) and that the length measured between the maxima it is also uncertain because some maxima have multiple peaks (M.N.Gnevyšev). In addition, the course of cycles is also hazy in periods when activity almost disappears (Maunder minimum) or when the course of activity appears differently than usual (around 1797, I.Usoskin).
In fact, it is possible to seriously doubt whether the "average period" makes sense speak. If two cycles with close periods run in parallel, some extreme may belong to one cycle and another to the other cycle, and some peaks may be the result of the sum of both cycles, while it can be difficult to guess which case it will be. The exact manifestation is on the one hand distorted by our imprecise methods of observation and it can also be influenced by secondary influences that are not known in the beginnings of theory construction.
Paradox of phenomena on the Sun
According to simple logic, higher solar activity could be accompanied by larger solar eruptions and subsequently also storms and possibly other phenomena on Earth.
However, it turns out that this is not the case. As for solar flares, such are known (e.g. eruption in 1941, eruption from 1972-73, etc.), which appear outside the interval of the highest activity of the Sun. And for geological phenomena, the opposite cases are even documented (e.g. volcanic eruptions in years with long-term lower activity - see chaotic periods in the theory of I. Charvátová).
In other words - with what we called negative factors - for solar activity, positive factors are often combined - for eruptions on the Sun and geological phenomena (earthquakes, volcanic eruptions) on Earth. We will go through some individual cases one by one:
Solar Storms
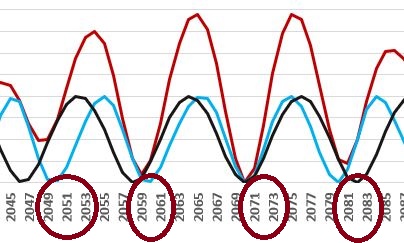
Three selected solar storms from 1882-1941-2000 follow each other with an interval of about 59-62 years. (The storm of 1582 also fits into the same grid.) The year 1941 is quite far behind the peak of the corresponding cycle (1937.4). What ties the events together are the fairly precise alignments of the two of the above functions around the years 1881-1941-2001.
17.-20.11.1882 |
1940 (March) 17-19.9.1941 |
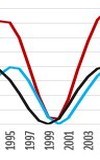
6.4.2000, 14.7.2000 (Bastille Day) 11.4.2001, 31.10.2003 (Halloween) |
| V-sun-EJS (1880) | EV-sun-JS (1940) | sun-VEJS (1999) |
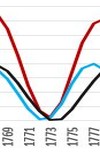
Storms certainly occur outside of this approximately 60-year cycle. However, some of them are still aligned with the functions - e.g. the storm of 1770 (September 17, 1770) we find about 10 years before the exact alignment, the minima of the functions se however, she didn't get too far from each other during this time.
Geological phenomena
On February 16, 1810, when a strong earthquake occurred in Crete. This earthquake was followed by disastrous ones in 1811-1812 earthquakes in New Madrid (12/16/1811, 1/23/1812 and 2/7/1812). The tremors turned the flow of the Mississippi River upstream,... This was followed by the Santa Barbara/Ventura earthquake (12/21/1812). The Tambora volcano erupted in 1815 (April 5-April 10, 2015). In the period 1811-1815, several other volcanoes erupted - Sabrina (1811), Soufriere and Awu (1812), Mayon (1814), ...
In Bohemia, a larger earthquake was registered on 14.1.1810 and later in 1813 and 1817.
| In 1810, Jupiter passes through perihelion, in opposition to Uranus and Neptune. (similar to 1667, at the time of Maunder's minimum). |
|
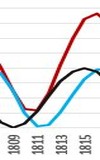
Tambora y.1815 |

Stromboli y.1822 (strong eruptions) |
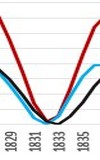
Babujan Island y.1831 Cosequina y.1835 |
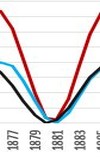
Tambora y.1880 Krakatoa y.1883 |
In addition to the Cosequina volcano (January 13, 1835), the Osorno and Aconcagua volcanoes also erupted. (the earthquake was detected about a month later, on 20.2.1835).
Further examples of geological event synchronicities follow the reader can find the extremes of the functions listed here on the page:
Natural phenomenaTransitional periods
In transitional periods (function in anti-phase) it is observed somewhat a different course of natural phenomena than outside them. The above major volcanic eruptions of 1815, 1822, 1835 and 1883 - as well as the eruption of the Pinatubo volcano in 1991 appeared outside the transition periods (1785-1805, 1845-1865, 1905-1925, 1965-1985,...)
Volcanoes tend to be classified into 3 types (S, R, G), with peaks of activity S and R type volcanoes were determined around 1930 and 1950 (i.e. outside of transitional periods), so far G-type volcanoes had minimum in this period, their maximum was around 1910, i.e. within the transition period.
Some large earthquakes are observed at the edges transitional periods, e.g. 1783, 1906, 1964 (year 2023-26?).
We find floods in transitional periods - e.g. floods in 1008 and 1068, or 1375 and 1434 - and beyond them - e.g. modern floods in the period (1985-2025).
More examples of phenomena observed during transitional periods is on the page:
Transitional periodsFading of transitional periods
Let us now focus on the short intervals beyond the end of the transitional periods. We have in mind the neighborhood of years (at intervals of approx. 59-61 years): 43, 104, 164, 224, 283, 342, 401-411, 471, 531, 590, 649, 709-719, 779, 838, 897, 947-957, 1007-1017, 1076, 1137, 1197, 1257, 1315-1325, 1384, 1445, 1503, 1563-1573, 1633, 1693, 1752, 1812, 1872, 1931, 1991, 2050, ...
Transition periods differ from each other in the shape of the curves, which is why they sometimes occur to shifts - extremes occur a few years earlier or later, than would be expected from the exact regularity of the 60-year cycles.
In 165 there was an earthquake in Western Europe, in 472 Vesuvius erupted, Rabaul (Annus Horribilis) joined Vesuvius around 536. R. 781 Fujisan, r.945-48 Paektu, r.1138 great earthquake in Syria Aleppo, r.1257 Samalas volcano - probably one of the largest known eruptions of ours recent history, 1315 Mount Tarawera volcano, 1444 Tyrrhenian eruption seas, 1573 earthquake in Italy, 1630-32 eruption of Vesuvius, 1693-94 Vesuvius and Stromboli, 1755 Great Lisbon Earthquake, 1811-12 California Earthquake, 1815 Tambora volcano, 1991 Pinatubo volcano...
Planets at perihelions
The gravitational pull between the Sun and a planet in an elliptical orbit changes. This variability can be particularly pronounced for Jupiter, with an orbital period of 11.86 years. Hints of the significance of this action can be found in the work of I. Charvátová, P. Kalenda and recently, for example, with the French scientists V.Courtillot, F.Lopes, J.L.Le Mouël.
A closer examination of the correlation of Jupiter's elliptical orbit and extremes of solar activity were published (at the end of the last century) by Timo Niroma. He summarized some of his conclusions in brief sentences, of which we consider the most important: "The sunspot minima prefer an area around the Jovian perihelion." (Sunspot minima prefer the region around Jupiter's perihelion).
Jupiter at perihelion
Let's note some records of activity minima in correlation with the position of Jupiter at perihelion.
Regularity with a recurrence period of approx. 165-180 years, i.e. the period of repetition of the positions of the outer planets, seems to be quite obvious - although it suddenly disappears after 1990.
Cycle Activity minimum J at perihelion -------------------------------------- -12 1610.8 1607,87 -11 1619.0 1619,73 -10 1634.0 1631,59 -9 1645.0 1643,46 -8 1655.0 1655,32 -7 1666.0 1667,18 -6 1679.5 1679,05 -5 1689.5 1690,91 |
Cycle Activity minimum J at perihelion -------------------------------------- 3 1775.5 1773,95 4 1784.7 1785,81 5 1798.1 1797,68 6 1810.6 1809,54 7 1823.3 1821,40 8 1833.9 1833,27 9 1843.5 1845,13 10 1856.0 1856,99 11 1867.2 1868,86 12 1878.9 1880,72 |
Cycle Activity minimum J at perihelion -------------------------------------- 20 1964.7 1963,76 21 1976.3 1975,62 22 1986.7 1987,49 |
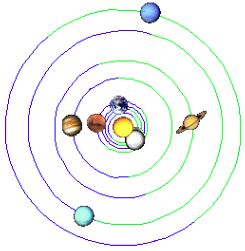
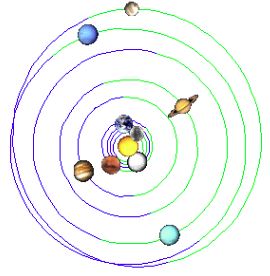
We are interested in which periods "dropped out" and where their midpoints are approximately. In the first period (1702-1762) we get approximately the year 1732, in the second (1892-1952) - the year 1922. If we shift the second center (about one cycle) back to 1911, we get:
J at perihelion ------------ 1702,77 1714,64 1726,50 1738,36 1750,22 1762,09 |
J at perihelion
------------
  1892,58
  1904,44
  1916,31
  1928,17
  1940,03
  1951,90
|
| r.1732 | r.1911 |
|
|
Similar oppositions J-S, U-N can also be found, for example, near years: 1057, 1216, 1395, 1573, respectively further 2071, 2090, 2249
Denial of planetary influence
If we try to prove the influence of the planets on the Sun, we must also refute the ideas of those who who say otherwise.
In 1913 G.F.Kronenberger (1885–1926) article "Sunspot and the planets". In the first part, for example, he lists the differences in the positions of the planets in years 1788, 1804 and 1837 in the times of maximum activity and further differences in the positions of the planets in 1810, 1843, 1867 and 1878 during times of minimal activity. But these listed data have one common denominator. Jupiter transited aphelion (among others) in 1791.75, 1803.61 and 1839.2, while it passed perihelion in 1809.54, 1845.13 and 1880.72.
Weakening quadratures?
We are talking - as in the previous ones about Jupiter-Saturn squares, let's go back to 1797 and ask why here (compared to other periods) didn't it show the maximum square footage? And why sometimes the maximum of squares composes with the aphelus of Jupiter and sometimes appears separately?
If we compare the extremes of activity exactly in quadratures, we always find a period with a high correlation and then a period when the effect of quadratures is not strong enough and is overlaid by other influences. We are interested in these periods - it actually works in the first approximation by the period when the quadratures coincide with the minima of activity.
This is approximately the period (with approximately one hundred years intervals):
1666-1698, 1755-1767, 1856-1887, 1964-1996.
The thought arises as to whether the quadrature effect can be weakened at the time when both Jupiter and Saturn pass through their perihelions at the same time. (Such periods do exist - thanks to the fact, that the lines of the apses of Jupiter and Saturn are approximately perpendicular to each other...)
We divide the years that meet this into two groups: I.1559, 1678, 1797, 1856, 1976 and II. 1618, 1737, 1916, 2035. The first group (in which we also included the year 1797) shows for the period when we cannot explain the extremes of activity with quadratures. During transitional periods, extremes of activity appear near Jupiter aphelus in the years: 1661, 1673, 1685 and later 1968.9, 1979.9.
But the question remains, how to explain why the same does not happen even for the years of the second group? Does the opposite sometimes happen to "strengthening the squares"? The relatively high maximum of 1738.7 occurs during the Jupiter-Saturn square, although both Jupiter and Saturn are near perihelion in 1737. This is the case at the time of the Uranus-Neptune opposition, while in 1738 it passes through opposition line Saturn. And an analogous situation can also be seen for the maximum of 1917.6.
Saturn at perihelion
    IsPericentre(Ls, Lsp, 2);

    1620,29              1649,94              1679,26              1708,91
    1738,24              1767,89              1797,21              1826,78
    1856,10              1885,67              1915,08              1944,57
    1973,89              2003,46              2032,78              2062,35
|
Let's now follow a series of years: 1620, 1679, 1738, 1797, 1856, 1915, 1973, 2033, 2091 (i.e. on the negative interference data of the two observed cycles). By supplementing with the centers of these intervals (i.e. with positive interference data) we get the following series: 1650,1709,1767,1826,1885,1944,2003,2062.
By comparison with the movement of Saturn, we find that in years of extreme interference (both positive and negative) cycle of Jupiter's aphelion and Jupiter-Saturn quadrature (in the period we are watching) Saturn is always in perihelion!
The above observation is apparently related (either as cause or effect) to the fact that that the lines of the apses of Jupiter and Saturn are almost perpendicular to each other.
Waldmeier's effect
Where they decide the solar activity of the planets squaring, resembles the approach to quadrature of the opening of an imaginary barrier, which triggers some current of energy. And the more the barrier opens, the faster the energy is discharged. This is the so-called Waldmeier effect. That is, the higher the extreme of activity - the shorter the current cycle.
If a link between lower activity and greater influence were demonstrated Jupiter, then in periods of lower activity the cycles are automatically longer, because the Jupiter period is longer than the Jupiter-Saturn half-period.
Minima in Jupiter-Saturn alignments
In some periods we can expect a progression of activity minima synchronous with the conjunctions and oppositions of Jupiter with Saturn.
        1633,31	1634.00
        1643,04	1645.00
        1653,76	1655.00
        --------------
        1713,31	1712.00
        1723,08	1723.50
        1732,32	1734.00
        1742,67	1745.00
        --------------
|
        1811,83	1810.60
        1821,69	1823.30
        1832,45	1833.90
        1842,18	1843.50
        --------------
        1901,73	1901.70
        1911,30	1913.60
        1921,61	1923.60
        --------------
|
        2020,83
        2030,69   ?
        2040,91   ?
|
Uranus-Neptune quadratures
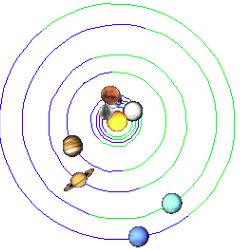
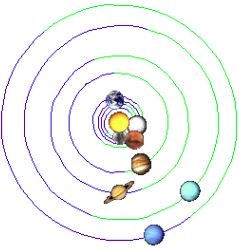
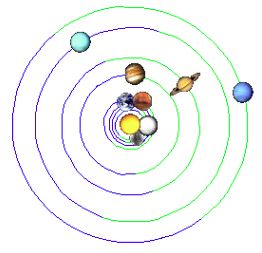
In the following diagrams, the longitudes of the planets Uranus and Neptune form an approximately right angle, i.e. they are in quadrature. At the same time, these positions were preceded (1-2 years in advance) and the quadrature of the planets Jupiter and Saturn (1778.4-1777.4=1.0 years, 1947.50-1946.47=1.03 years, 1957.90-1956.17=1.73 years):
The following three images represent the position of the planets at the time of greatest extremes (maximums) of solar activity of the last three centuries....
23.5.1778
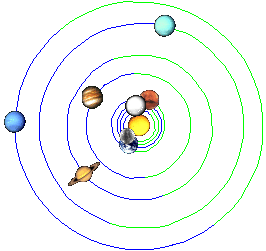 30.6.1947
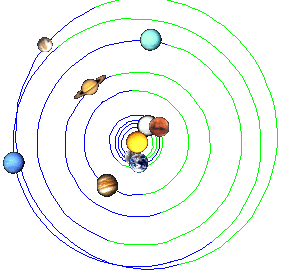 22.11.1957
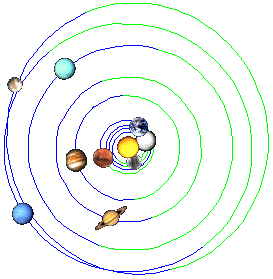
Five of the ten largest sunspots of 1874-2014 were observed between 1946-1951. (Positions from 1778 and 1957 are similar, in accordance with the 178-180-year cycle of positions of the outer planets).
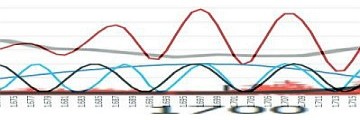
A gradual increase in activity (in red) in the first half of the 20th century, can be simply modeled by a combination of three influences:
- cycle of Jupiter (in black)
- of the Jupiter-Saturn cycle (pale blue)
- Uranus-Neptune cycle (blue)
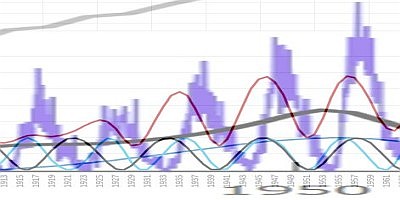
However, the Uranus-Neptune quadrature does not always come to the fore like this.
The quadrature of 1698 disappears at the time of the Maunder minimum and the Sun
it only wakes up from the minimum about 10 years later.
Gleissberg's maxima
Gleissberg(1965)
| Pořadí | 1 | 2 | 3 | 4 | 5 | 6 | 7 | 8 | 9 | 10 | 11 | 12 |
| Gleissberg | 360 | 440 | 510 | 575 | 665 | 755 | 840 | 920 | 990 | 1115 | 1185 | 1250 |
| Kvadratura U#N | 322 | 409 | 495 | 581 | 667 | 754 | 839 | 926 | 1011 | 1098 | 1183 | 1270 |
| Pořadí | 13 | 14 | 15 | 16 | 17 | 18 | 19 | 20 | 21 | 22 | 23 | 24 |
| Gleissberg | 1305 | 1375 | 1455 | 1545 | 1605 | 1715 | 1765 | 1840 | 1955 | |||
| Kvadratura U#N | 1355 | 1441 | 1527 | 1613 | 1698 | 1784 | 1869 | 1955 | 2041 | |||
In periods near the last two quadratures (1869, 1955) higher amplitudes of solar cycles are observed (in the years 1840-1880, 1930-1970), while in the intervening period 1880-1930 the amplitudes were lower. (At the same time, according to observations in Great Britain, there were periods of quadrature air temperature in phase with activity cycles, while not in the intermediate period).
Maunder's minimum
The complete relaxation of the Sun during the so-called Maunder minimum is a mystery. Derive it only from the Uranus-Neptune conjunction of 1650 and related to it retrograde movement of the Sun is not possible at every Uranus-Neptune conjunction such minima do not occur.
The period after 1650 is often considered to be the Maunder Minimum, but there are indications that some significant ones have occurred on the Sun changes already earlier - the Sun began to rotate faster. In the years 1611-1613 one revolution of the Sun on the equator lasted 26,163 days, in the years 1625-1626 24,913 days and in the years 1642-1644 24.3 days. In the following centuries, the Sun gradually slowed down again.
Regarding the height of the maximum, however, a more significant decrease was actually observed after 1650. The height of the maximum in 1625 was still about 115, the height of the maximum in 1639 was about 100. The highs of 1650, 1661, 1673, 1685 and 1694 do not deviate from the interval of values 10-45 and the increase occurred only after 1700 - with heights at the maximum in 1705 of approx. 70, at the maximum in 1718 approx. 90 and at the maximum in 1727 with a height of approx. 140.
|
After the conjunction from 1650, the angle between the planets Uranus and Neptune gradually opens up, in 1662 (picture) they move approximately at the longitude of Jupiter's perihelion, followed by Jupiter and Saturn. |
| Around 1665 (picture) Saturn is in aphelion. Jupiter is inside the Uranus-Neptune angle and is approaching perihelion in 1667. In 1667 it is already between Uranus and Neptune wedged by Saturn, while the strength from Jupiter does not decrease because it has moved to perihelion. |
|
| Before the conjunction of Uranus with Neptune observed after 1662 gradually to disconnect, Jupiter and Saturn must pass around it several times (Jupiter 4x, Saturn 2x), here is the lineup in early 1705: |
|
The periods 1600-1630 and 1660-1690 were transitional. But he must have had some influence significant weakening of both functions in antiphase.
Low highs in 1650,1661,1673,1685,1694 and 1705. roughly correspond to Jupiter's transits through the aphelion 1649.39, 1661.25, 1673.11, 1684.98, 1696.84 and 1708.7:

Situation around 2000
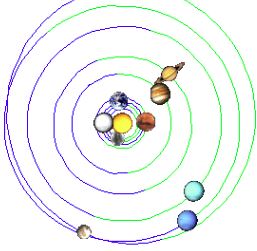
|
The distribution of the planets in the year 2000 resembles the distribution from the year 1662, here, however, Jupiter and Saturn are already behind the Uranus-Neptune conjunction line and therefore a similar development as after 1662 could not be expected. |
And also - the closest transitional periods to the year 2000 are 1960-1990, 2020-2050, therefore, the year 2000 does not interfere with them.
Carrington's extreme
We refer to the Carrington extreme as the maximum activity in 1860.1 associated with the proton event and the great solar storm on September 1, 1859. Large sunspots were observed in 1859-60. In connection with this extreme, the aurora borealis of December 14, 1862 is also mentioned. Sometimes they also talk about the second maximum in 1864(?).
At the time of the extreme of 1860, neither of the two main influences we are considering is extreme. The Jupiter-Saturn quadrature occurred already in 1857, Jupiter was aphelus only in 1862 and the exact quadrature of Uranus-Neptune only in 1869.
The year 1857 is 60 years after the previously observed year 1797. And the year 1858.5 (Wolf Cycle No. 10) is approximately in the middle between the extremes of 1727.5 (Wolf Cycle No.-2) and 1989.6 (Wolf Cycle No. 22) - with a gap of about 131 years between these dates.
| Carrington proton event, solar superstorm, 1.9.1859 | The Civil War Aurora, Aurora Borealis, 14.12.1862 |
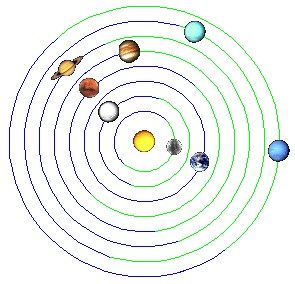
|
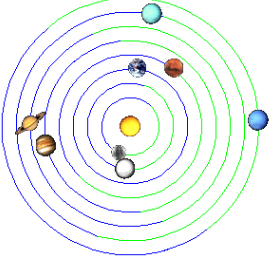
|
The difference between the dates is 1200 days, i.e. approximately 2*(V,E) (= 2*584 days = 1168 days). (Does the Venus-Earth opposition increase the effect of the Jupiter-Saturn conjunction?!)
Multiple maxima
For years with double or multiple maxima, e.g. 1829, 1894, 1906, 1928. The highs of 1906, 1928 are on the edges of the transitional period:
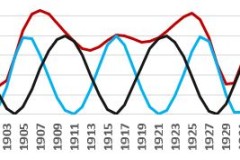
The problem with clarifying the extremes
The First Wolf Cycle Problem
The stated maximum of 1761 does not correspond in any way to the above-mentioned curves, near 1761 Jupiter is near perihelion and conjunct Saturn (and Uranus). Even so, it is apparently intended correctly - a similar situation occurred recently the past again, at its peak in 1989-90, as we will see in the following paragraph.
Observations of sunspots in the years 1761-1776 were carried out by Christian Horrebow (1718-1776), however, records from 1762-1763 have not survived.
Fires of 1871
A similar situation appears approximately 109 years later, in 1870. Here, too, there is maximum activity with Jupiter near perihelion and in conjunction with Saturn and this time near the Uranus-Neptune square (1869). There was an extreme drought in America after 1870, as a result of which there were 2 fires (the Peshtigo fire and the Chicago fire) that arose from not entirely clarified causes on the same day 8/10/1871, spread to several states.
The position of the planets on 8/10/1871 resembles the position at the time of Carrington solar storm 1/9/1859. Jupiter near conjunction with Uranus he is on his way to his aphelion. Neptune is to these planets approximately in square and Saturn in 1859 in conjunction and in 1871 in opposition to Jupiter. The agreement is also that in both cases is Earth conjunct Neptune and Mars conjunct Saturn. AND Venus is in opposition in 1859 and in conjunction with the Earth in 1871.
The problem of the end of the 20th century
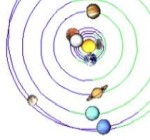
In one of the opening paragraphs about planetary conjunctions and their influence on we mentioned solar activity minima around the years 1306 and 1810. As simple as that, there is no causal connection. 179 years later, in 1989 - with a very similar position of the planets - a high maximum activity occurred.
| Minimum 1810 | Maximum 1989 |
|
|
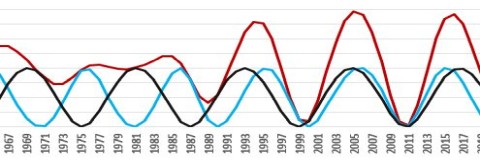
Prediction of solar activity at the end and turn of the 20th century (see prediction in the table according to Waldmeier and Schove) failed - extremes expected around 1993 and 2004 appeared about 4 years earlier.
High activity in 1989-90 (second highest level since Galileo's observations) follows approximately 262 years after the maximum in 1727, 229 years after the above-mentioned maximum in 1761 and 131 years after Carrington's maximum in 1859. What caused it is a mystery, as is the origin of the potential 130-year cycle. The years 1761 and 1989 are slightly reminiscent of Pluto (it passes through perihelion in 997, 1245, 1493, 1741, 1989 and 2237).
| Cycle | 19 | 20 | 21 | 22 | 23 | 24 | 25 |
| Waldmeier, 1966 | 1968.9 | 1981.2 | 1993.0 | 2004.0 | |||
| Schove, cca 1950 | 1958.5 | 1972.5 | 1984.5 | 1994.5 | 2004.5 | 2014.5 | 2025.5 |
| Skutečnost | 1957.9 | 1968.9 | 1979.9 | 1989.6 | 2000.3 | 2014.0 |
According to the features we are tracking here, the extremes come out in this period also differently than in reality:
In addition, it was also observed that:
- The storm on the Sun in August 1972 (largest dimension 4/8/1972) was stronger than the storm in 1959.
- The strongest eruption of the 24th cycle was (X93) on September 6, 2017.
Highest activity in the 20th century (including a large number of solar storms) it is associated with the years 1957-1960 and 1989-1991. Saturn was in aphelus in 1959.6 and 1988.7, Jupiter passed through the aphelion in 1957.8 and in 1993.4 (in 1987.5 it was still at perihelion). The means of the corresponding extremes are 1958.7 and 1991.1 and their deviation from the extremes from observations (maxima: 1957.9, 1989.6, medians: 1958.6, 1990.7) is on the order of one year.
Planet X
One of the few ways not to throw away the entire concept presented here, is a consideration of another body or bodies beyond the solar system, as we know it today.
A planet with a period of about 390 years
A reflection on what relationships a planet would bring to the Solar System with a period of about 390 years, the reader will find on this page:
Planet XThe proposal was based on the idea that Planet X should not - in the synodic periods with other bodies - disrupt the cycle with period B=427 years, respectively 2B=854 years observed in the Solar System. At the same time, she was supposed to introduce a period of approx. 109 years (3 Bruckner periods) into the system, which is observed in the Solar System and climate and for which we have no other suitable explanation. There is a 109 year period in this proposal by the synodic period (period of conjunction) of the planet X with the planet Uranus.
A planet with a period of about 575 years
The reader can find a reflection on a planet with a period of approx. 575 years here:
Shape functionsIf we consider that period of about 105-125 years, which it seems to be Solar activity - compared to during known planets - disturbed is the period of the quadratures of some two bodies, then the real synodic the period of the bodies must be double, say approximately 2*115 = 230 years. Planet Neptune would have such a synodic period with planet X then if X had a period of about 575 years.
A period of 575 years is observed in the movements of some planets and forms with the planet Uranus synodic period of about 98 years, which resembles the cycle with which the phases of the Solar Cycles are disturbed - especially when comparing with the squares of the planets Jupiter and Saturn.
Predictions
The Jupiter Effect
The authors (John R.Gribbin and S.Plagemann) of the book The Jupiter effect (1974) predicted from the alignment of the planets a great earthquake on 10.3.1982.

The failure of this prediction is sometimes recalled, when other predictions appear, e.g. when an increase in geological activity was predicted for a period of around 2020. However, we observe a significant difference between 1982 and 2020:

Storm prediction
The 1882-1941-2000 solar storms above roughly coincide with the extremes of planetary tidal action on the Sun - in various combinations of the alignment of the bodies of Jupiter, Saturn, Earth and Venus. However, the action of the planets Venus and Earth is apparently secondary (due to the small periods). We consider the Jupiter-Saturn conjunction (blue curve) to be the main factors and perihelion transits of Jupiter (obvious by the black curve). Hence the years of possible future storms:
It is known that if a larger active area or a larger sunspot remains in the sun longer period (such as in 1840-41 one of the spots of 18 months), geomagnetic storms can be expected to recur on Earth with a period rotation of the Sun - i.e. from the point of view of Earth, approx. 27 days.
Prediction of ice ages
Similar distributions of the planets can be found before our era, e.g. in 922 BC, 743 BC (Homer's minimum ca. 770 BC), 245 BC and 67 BC. Starting from the beginning of the year, we find a similar picture after 113 (when the tables compiled by Justin Schove indicate very low solar activity with uncertain extremes). Another similar position can only be found in 1483 (the period 1460-1550 is the so-called Sporer's minimum), respectively then in the year observed by us in 1662 (the so-called Maunder minimum in the period 1645-1715).
Under the above assumptions, we can then predict small ice ages approximately for the period after 2158, 2337 and potentially 2517. These predictions of a decrease in activity correspond to the results from the observation of the so-called cycle overlap (here, the minimums were estimated from the graph around the years 2150, 2350 and 2500). Cycle Overlapping is discussed at:
Babylonian period