Solar activity - Resonance
| A.M.Molchanov, Russian mathematician. He devoted himself to mathematical modeling in biology, ecology, genetics, etc. He assumed resonance structure of the solar system. The development of the planet's leads to resonances and orbital periods in the ratio of small integers. He suggested some relationships for both the sun and the sun system, as well as for the systems of Jupiter and Saturn. |
Resonance of orbital periods
Introduction
Three Jupiter and three Uranus moons respect the so-called Laplace resonance, which limits the possibility of multiple conjunctions. It is a certain principle of minimal interaction - which ensures balance.
Therefore, resonance does not generally only represent a disturbing element (which can break objects, destroy bridges, etc.), but it can also be a thing to ensure synchronization and stability.
There is a simple argument regarding the moon of Jupiter / Uranus: they are synchronized thanks to the tidal forces. According to A.M.Molchanov (1965, 1968), however, the bodies can be synchronized even when operating by very weak forces. Molchanov considers "small dissipative forces", in some newer theories also other hypotheses were proposed (M. B. Gubaidullin, 2015, see also N. Scafetta, 2013).
According to the behavior of Jupiter / Uranus moons, generalization offers: multiple conjunctions of bodies are not desirable in the Solar System - there is a tendency for them to appear only minimally, not to appear exactly or to be somehow balanced.
Small (tidal) effects can enhance the natural oscillation of the solar atmosphere and cause great changes.
Resonances of the inner planets
J.J.Condon and R.R.Schmidt at work (1975) derive a resonance relationship in the form Lt = 3 * Lv -5 * Le + 2 * Lj where Lv, Le and Lj are the longitude of Venus, Earth and Jupiter.
From the comparison of the synodic periods of the planets,
((E, J) / 5, (V, J) / 3) = 2 · W. Then 1 / (2W) = 3 / V-5 / E + 2 / J, and 2W = 22.13505 years,
ie, W = 11.06753 years .
Maximum solar activity occurs approximately when (for the longitude of Venus,
Earth and Jupiter):
3LV - 5LE + 2LJ = kπ
But that does not always apply ...
Wilson's refinement
Here we derive:
41LV - 69LE + 28LJ = kπ
A period of 22,386 years is based on 41/69 (K.Takahashi, 1967).Maya
For 2W = 22.3855 years, Jupiter will go back by 40.6 dg, ie, if we observe the system with a 2W period, we will sense that Jupiter is orbiting the period with the period about 198.4 years. If he really moved, he would meet Saturn every 25.65 years, ie 4 * I or 3 * Y, where I is the period of the inner planets = 6.4 years and Y is 8.54 years. The difference between 25.65 and 22.39 years is 3.26 years. (52 Tun / 72 Almanac Cycle 18720 d, Calendar Round 52 Haab / 73 Almanac Cycle 18980 d).
Molchanov's Resonances
Molchanov's Resonance: [M, -V, -E / 2, -R] [V, -R / 3, -S] [E, -R, 2, J, / 2] [U, -U / 7], [U, -N / 2], [U, -P / 3] (plus their linear combination ...)
Resonance with period H
In the repetition of the climatic periods, there is a so-called Hallstatt cycle (H = 2300 years) which correlates with the resonance of orbital periods of outer planets.
The difference of 2403.05 years and 2224.10 years (with the sum of 4627 years) is 178.95 years, but the common divisor is the period 185.1 years (+ -0.2 years) which can be modeled by resonance 1 / J-3 / S + 2 / N (or ((U, N), H)).
Balancing of Jupiter
Influence of Neptune
Line of conjunctions V-E-J move (backward) with period: P=
(W,J) = (11.06753, 11.861983) = 165.25 years, i.e. approximately
with orbital period of Neptune.
Axial period Jupiter-Neptun [J,N] = 22.13075 y = 2*11.06538 years
coincides with period of Solar activity.
Some authors (Ray Tomes,…) connect solar period with these two bodies ( Jupiter, Neptune).
(In combination with resonance of inner planet it leads to
6/V-10/E+3/J-1/N = 0, i.e. unstable resonance).
Importance of Jupiter (with a view to the weight) is clear.
Neptune might acquire its influence by the distance from the
sun, see, for example value (M * R2 (moment of inertia):
| M [1024 kg] | a [109 m] | M*a2 [1039kg*m²] | |
| Jupiter | 1899,0 | 778,6 | 1151,2 |
| Saturn | 568,0 | 1433,5 | 1167,2 |
| Uran | 86,8 | 2872,5 | 716,2 |
| Neptun | 102,0 | 4495,1 | 2061,0. |
Resonance
Also period of resonance 1/W = 1/J + 1/U – 1/N correlates by value W = 11.094 years with the mean period of the Solar cycle. Let us write it to form of stable resonance: 1/W - 1/J + 1/N - 1/U = 0.
Resonance maxima occur, when it holds (for longitudes of Jupiter,
Jupiter perihelion, Uranus and Neptune):
Lj – Ljp + Lu - Ln = π+2kπ
Resonance minima occur, when it holds (for longitudes of
Jupiter, Jupiter perihelion, Uranus and Neptune):
Lj – Ljp + Lu - Ln = 2kπ
This resonance binds the period of solar activity W with orbital periods of planets Jupiter, Neptune, Uranus. Saturn's here seemingly outside game - however it is bound by resonance of outer planets to Jupiter perihelion (viz Influence of Jupiter)!?
Depiction of the relationship
The resonance arise as a sum of the two delta angles ∆J + ∆UN where:
- ∆J = Lj-Ljp (Jupiter with regard to its perihelion)
- ∆UN = Lu-Ln (Uranus with regard to Neptune).
| n | Mo | ∆J | ∆UN | n | Mo | ∆J | ∆UN | n | Mo | ∆J | ∆UN | n | Mo | ∆J | ∆UN | |||
| -30 | 1416,7 | 316 | 224 | -14 | 1594,4 | 306 | 234 | 2 | 1772,0 | 296 | 244 | 18 | 1949,5 | 283 | 257 | |||
| -29 | 1428,0 | 296 | 244 | -13 | 1605,6 | 286 | 254 | 3 | 1783,1 | 273 | 267 | 19 | 1960,5 | 257 | 283 | |||
| -28 | 1439,2 | 275 | 265 | -12 | 1616,6 | 262 | 278 | 4 | 1794,1 | 246 | 294 | 20 | 1971,4 | 229 | 311 | |||
| -27 | 1450,2 | 251 | 289 | -11 | 1627,6 | 235 | 305 | 5 | 1805,0 | 218 | 322 | 21 | 1982,4 | 203 | 337 | |||
| -26 | 1461,2 | 224 | 316 | -10 | 1638,5 | 207 | 333 | 6 | 1815,9 | 192 | 348 | 22 | 1993,4 | 180 | 0 | |||
| -25 | 1472,0 | 197 | 343 | -9 | 1649,4 | 182 | 358 | 7 | 1826,9 | 168 | 312 | 23 | 2004,5 | 159 | 21 | |||
| -24 | 1483,0 | 172 | 8 | -8 | 1660,5 | 160 | 20 | 8 | 1838,1 | 149 | 31 | 24 | 2015,7 | 140 | 40 | |||
| -23 | 1494,1 | 150 | 30 | -7 | 1671,6 | 140 | 40 | 9 | 1849,3 | 130 | 50 | 25 | 2026,8 | 120 | 60 | |||
| -22 | 1505,3 | 130 | 50 | -6 | 1682,8 | 120 | 60 | 10 | 1860,4 | 109 | 71 | 26 | 2037,9 | 96 | 84 | |||
| -21 | 1516,4 | 110 | 70 | -5 | 1694,0 | 99 | 81 | 11 | 1871,5 | 85 | 95 | 27 | 2049,0 | 70 | 110 | |||
| -20 | 1527,5 | 88 | 92 | -4 | 1705,0 | 74 | 106 | 12 | 1882,5 | 58 | 122 | 28 | 2060,0 | 42 | 137 | |||
| -19 | 1538,6 | 63 | 117 | -3 | 1716,0 | 47 | 133 | 13 | 1893,5 | 31 | 149 | 29 | 2071,1 | 18 | 162 | |||
| -18 | 1549,6 | 36 | 144 | -2 | 1727,1 | 21 | 159 | 14 | 1904,6 | 7 | 173 | 30 | 2082,3 | 356 | 184 | |||
| -17 | 1560,7 | 10 | 170 | -1 | 1738,2 | 357 | 183 | 15 | 1915,9 | 346 | 194 | 31 | 2093,6 | 336 | 204 | |||
| -16 | 1571,9 | 346 | 194 | 0 | 1749,5 | 336 | 204 | 16 | 1927,2 | 326 | 213 | 32 | 2104,8 | 316 | 224 | |||
| -15 | 1583,7 | 326 | 214 | 1 | 1760,8 | 316 | 224 | 17 | 1938,4 | 306 | 234 | 33 | 2116 | 294 | 246 |
Observed maximum so (according to axes direction) can be of 4 distinct types,
see e.g. I.1727.5 (140.0), II.1870.6 (140.5), III. 1989.6 (150.1), IV. 1957.9 (201.3) :
Maxima of Solar activity
Comparison of extremes
In the following overview these maxima are compared:- maximum of Solar activity MS
- maximum of Wood's resonance of inner planets MI: 3LV - 5LE + 2LJ = kπ
- maximum of resonance of balancing the outer planets MO: LJ - LN + LU = LJP + π (+2kπ)
- maximum of resonance of geometrical axes MA: (LJ - LS) + (LN - LU) = kπ/2
1500-1650
| N | WS | WI | WO | WA | WI-WS | Wo-WS | Wo-WI | |
| -23 | 1492 | 1494,6 | 1494,1 | 1490,4 | 2,6 | 2,1 | -0,5 | |
| -22 | 1505 | 1505,8 | 1505,2 | 1501,6 | 0,8 | 0,2 | -0,6 | |
| -21 | 1519,0 | 1517,3 | 1516,4 | 1513,1 | -1,7 | -2,6 | -0,9 | |
| -20 | 1528,0 | 1527,5 | 1527,5 | 1523,7 | -0,5 | -0,5 | 0,0 | |
| -19 | 1539,0 | 1539,1 | 1538,6 | 1535,6 | 0,1 | -0,4 | -0,5 | |
| -18 | 1548,0 | 1549,6 | 1549,6 | 1546,9 | 1,6 | 1,6 | 0,0 | P-maximum |
| -17 | 1558,0 | 1560,8 | 1560,7 | 1558,1 | 2,8 | 2,7 | -0,1 | |
| -16 | 1572,0 | 1572,5 | 1571,9 | 1570,1 | 0,5 | -0,1 | -0,6 | |
| -15 | 1581,0 | 1583,6 | 1583,7 | 1580,4 | 2,6 | 2,7 | 0,1 | |
| -14 | 1591,0 | 1594,6 | 1594,4 | 1591,7 | 3,6 | 3,4 | -0,2 | |
| -13 | 1604,0 | 1606,2 | 1605,6 | 1602,8 | 2,2 | 1,6 | -0,6 | 1607 - Kepler's spot |
| -12 | 1615,5 | 1616,8 | 1613,1 | 1613,0 | 1,3 | 1,1 | -0,2 |
1618 - Simon Mair's (Marius) spots |
| -11 | 1626,0 | 1627,8 | 1627,6 | 1625,3 | 1,8 | 1,6 | -0,2 | |
| -10 | 1639,5 | 1638,8 | 1638,5 | 1636,3 | -0,7 | -1,0 | -0,3 |
| n | WS | WI | WO | WA | WI-WS | WO-WS | WO-WI | |
| -9 | 1649,0 | 1649,9 | 1649,4 | 1647,5 | 0,9 | 0,4 | -0,5 | |
| -8 | 1660,0 | 1660,8 | 1660,5 | 1659,2 | 0,8 | 0,5 | -0,3 | 1660 - Hevelius spots, 1661 - Boyle and Picard sunspot group |
| -7 | 1675,0 | 1672,2 | 1671,6 | 1669,5 | -2,8 | -3,4 | -0,6 | 1671 (August) - Pickard spot, Hevelius spot, 1676 - Pickard extreme, Maunder |
| -6 | 1685,0 | 1682,5 | 1682,8 | 1681,0 | -2,5 | -2,2 | 0,3 | 1684 - Pickard extreme, Cassini, Kirch |
| -5 | 1693,0 | 1693,5 | 1694,0 | 1692,2 | 0,5 | 1,0 | 0,5 | |
| -4 | 1705,5 | 1705,2 | 1705,0 | 1703,1 | -0,3 | -0,5 | -0,2 | |
| -3 | 1718,2 | 1716,0 | 1716,0 | 1715,2 | -2,2 | -2,2 | 0,0 | 1716 - visible aurora, 1714-15 - P-maximum, end of Maunder period |
| -2 | 1727,5 | 1727,4 | 1727,1 | 1726,3 | -0,1 | -0,4 | -0,3 | |
| -1 | 1738,7 | 1738,5 | 1738,2 | 1737,8 | -0,2 | -0,5 | -0,3 | |
| 0 | 1750,3 | 1750,1 | 1749,5 | 1749,2 | -0,2 | -0,8 | -0,6 | 1752 - second maximum |
| 1 | 1761,5 | 1761,3 | 1760,8 | 1759,7 | -0,2 | -0,7 | -0,5 | |
| 2 | 1769,7 | 1771,8 | 1772,0 | 1771,4 | 2,1 | 2,3 | 0,2 | 1774 - second maximum |
| 3 | 1778,4 | 1782,8 | 1783,1 | 1782,3 | 4,4 | 4,7 | 0,3 | |
| 4 | 1788,1 | 1794,5 | 1794,1 | 1793,4 | 6,4 | 6,0 | -0,4 |
| n | WS | WI | WO | WA | WI-WS | WO-WS | Wo-WI | |
| 5 | 1805,2 | 1805,5 | 1805,0 | 1805,7 | 0,3 | -0,2 | -0,5 | |
| 6 | 1816,4 | 1815,6 | 1815,9 | 1816,3 | -0,8 | -0,5 | 0,3 | |
| 7 | 1829,9 | 1827,2 | 1826,9 | 1827,7 | -2,7 | -3,0 | -0,3 | |
| 8 | 1837,2 | 1838,3 | 1838,1 | 1838,7 | 1,1 | 0,9 | -0,2 | |
| 9 | 1848,1 | 1849,2 | 1849,3 | 1848,9 | 1,1 | 1,2 | 0,1 | 1847-48 - Giant sunspots |
| 10 | 1860,1 | 1860,2 | 1860,4 | 1860,7 | 0,1 | 0,3 | 0,2 | 1859 - proton event (Carrington), 1864 - second maximum, 1859-60 - Giant sunspots |
| 11 | 1870,6 | 1871,3 | 1871,5 | 1871,6 | 0,7 | 0,9 | 0,2 | 1870-71 - Giant sunspots, 1870 - proton event (Young) |
| 12 | 1883,9 | 1881,7 | 1882,5 | 1882,9 | -2,2 | -1,6 | -0,8 | 1882 - P-maximum, 1882 - Giant sunspot, 1882 - proton events (Maunder) |
| 13 | 1894,1 | 1893,5 | 1893,5 | 1894,9 | -0,6 | -0,6 | 0,0 | 1892-93 - Giant sunspots, 1892 - proton events (Rudeaux) |
| 14 | 1907,0 | 1904,5 | 1904,7 | 1905,7 | -2,5 | -2,3 | -0,2 | 1905,07,08 - Giant sunspots, 1908 - proton event |
| 15 | 1917,6 | 1916,1 | 1915,9 | 1917,3 | -1,5 | -1,7 | -0,2 | 1917 - Giant sunspot, 1917 - proton event |
| 16 | 1928,4 | 1926,7 | 1927,2 | 1928,4 | -1,7 | -1,2 | -0,5 | 1926,29 - Giant sunspots, 1926 - proton event |
| 17 | 1937,4 | 1937,9 | 1938,4 | 1939,1 | 0,5 | 1,0 | 0,5 | 1935,37-42 - Giant sunspots, 1938 - proton event |
| 18 | 1947,5 | 1949,5 | 1949,6 | 1951,1 | 2,0 | 2,1 | 0,1 | 1946 - proton event, 1949 - proton event |
| n | WS | WI | WO | WA | WI-WS | WO-WS | WO-WI | |
| 19 | 1957,9 | 1960,5 | 1960,5 | 1962,1 | 2,6 | 2,6 | 0,0 | 1958 - the highest level since Galileo's observations (1610), 1956,59-61 - proton events |
| 20 | 1968,9 | 1972,2 | 1971,4 | 1973,8 | 3,3 | 2,5 | -0,8 | 1969 - proton event, 1972 - extreme flare, 1972 - second maximum |
| 21 | 1979,9 | 1983,2 | 1982,4 | 1985,5 | 3,3 | 2,5 | -0,8 | 1981 - extreme flare |
| 22 | 1989,6 | 1993,2 | 1993,4 | 1996,1 | 3,6 | 3,8 | 0,2 | 1990 - the second highest level since Galileo's observations (1610) |
| 23 | 2000,5 | 2004,3 | 2004,6 | 2007,8 | 3,8 | 4,1 | 0,3 | |
| 24 | ? | 2015,3 | 2015,7 | 2018,3 | ? | ? | 0,4 | |
| 25 | ? | 2026,1 | 2026,8 | 2028,9 | ? | ? | 0,7 | |
| 26 | ? | 2036,6 | 2037,9 | 2040,9 | ? | ? | 1,3 | |
| 27 | ? | 2048,1 | 2049,0 | 2051,5 | ? | ? | 0,9 | 2050-51 - P-maximum |
| 28 | ? | 2059,5 | 2060,0 | 2063,4 | ? | ? | 0,5 | |
| 29 | ? | 2070,6 | 2071,1 | 2074,7 | ? | ? | 0,5 |
Subsequent considerations
Regularities
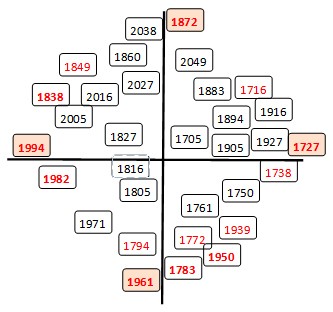
Theoretical extremes (maxima as well as minima) of solar activity take place about with the same period as the actual extremes. The biggest differences in maximum are observed in years 1583-1606, 1675-1685, 1778- 1788, 1829, 1958-2000. The biggest differences in minimum are observed in years 1553,1619, 1784, 1902-1924,1996.
Justin Flynn has noticed certain regularities of these deviations (personal communication).
Consider the following chart:
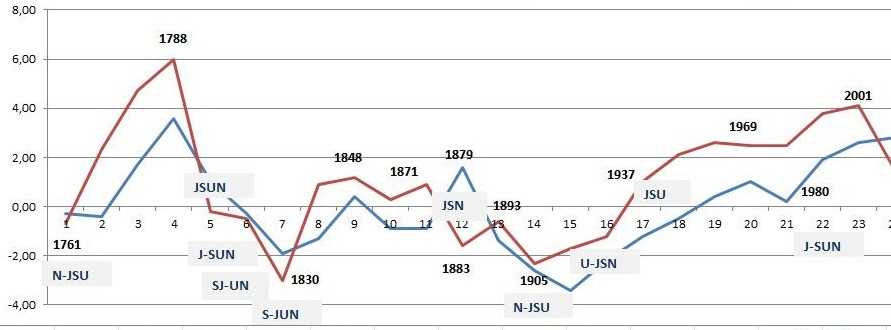
Rule of alternating deviations
Let us divide the Uranus-Neptune conjuction cycle to following time-periods, and to write departures taken from the column Mo-MS of the tables above:
    Time-      Departures
    period     sign  maxima   minima
    ------------------------------------
    1543-1586  -
    1586-1628  +
    1628-1671  -
    1671-1714  +
    1714-1757  -  1718-1761  1745-1765
    1757-1800  +  1769-1788  1777-1799
    1800-1842  -  1805-1830  1810-1832
    1842-1885  +  1838-1871  1844
    1885-1928  -  1884-1928  1856-1943
    1928-1971  +  1938-2004  1954-2008
    1971-2014  -  ?????????
    2014-2057  +
For the period 1714 -1971 all seems to work quite well. But this rule (like the rule from the paragraph Coincidence of geometrical axes) fails - and again roughly after year 1960!?)
Correction of extremes WO
Let dUN = Neptune.Longitude - Uranus.Longitude, dJJa = Jupiter.Longitude - Jupiter.LongPerihelion - 180 and we look for extremes where dUN + correction = dJJa (with a given precission, e.g. 5 dg).
The following function was derived from the previous paragraph: f = Cos(2*dUN) * abs(Cos(2*dUN)) = sign(Cos(2*dUN)) * Cos2(2*dUN) with a correction angle equal to k * f. For value of the constant k = 120 we get the following table:
Table of corrected extremes
    Diff    Theory     Jp    J    S    U    N  f(dUN)  Corrected   Observation
 ------------------------------------------------------------------------------
    11,28   1749,39 -  15  346  231  322  118  +0.38   1750,73     1750.3  *
1757
    11,25   1760,65 -  14  326  358    6  143   0.00   1760,72     1761.5  *
    11,20   1771,84 +  14  305  146   51  167  -0.30   1770,79     1769.7  *
    11,09   1782,93 +  13  281  276   98  191  -0.87   1779,56     1778.4  *
    11,01   1793,94 +  14  256   46  148  215  -0.70   1791,19     1788.1  ?
1800
    10,92   1804,86 -  15  229  191  200  238  +0.06   1805,13     1805.2  *
    10,92   1815,79 -  15  203  314  249  262  +0.98   1819,56     1816.4  ?
    11,01   1826,79 -  14  179   92  296  286  +0.73   1829.80     1829.9  *
    11,14   1837,94 +  14  159  233  340  310  +0.21   1838,80 	   1837.2  .
1842
    11,17   1849,11 +  14  140  359   24  334  -0.02   1849,04     1848.1  *
    11,17   1860,28 +  14  119  147   69  359  -0.48   1858,55     1860,1  *
    11,12   1871,39 +  15   97  277  118   24  -0.99   1868,05     1870,6  ?
    10,98   1882,37 -  15   69   48  169   48  -0.29   1881,41     1883,9  ?
1885
    11,01   1893,38 -  14   41  193  220   72  +0.25   1894,28     1894,1  *
    11,14   1904,52 -  14   17  318  270   97  +1.00   1908,13     1907,0  *
    11,23   1915,75 -  14  356  101  315  122  +0.66   1918,04 	   1917,6  *
    11,34   1927,08 -  16  338  242  360  147  +0.14   1927,54     1928,4  *
1928
    11,23   1938,31 +  16  317   10   44  171  -0.08   1938,11     1937,4  *
    11,12   1949,42 +  14  294  157   91  195  -0.63   1947,03 	   1947,5  *
    10,98   1960,40 +  14  267  284  141  218  -0.99   1956,54     1957,9  *
    10,90   1971,30 +  14  239   55  192  242  -0.03   1971,21     1968,9  ?
1971
    10,95   1982,25 +  15  214  199  242  265  +0.68   1984,90     1979,9  ??
    11,03   1993,29 +  16  191  323  289  289  +0.94   1997,03     1989,6  ??
    11,12   2004,40 +  15  170  105  334  313  +0.47   2006,28 	   2000,5  ??
    11,14   2015,55    14  150  243   17  338  +0.78   2015,70             ?
2014
Rows with "acceptable" results are marked by asterisks.
Other resonances
Listing
Resonances observed above are not only resonances producing cycles with period close to the period of solar activity. For example (J/1,-S/2,+U/4,-N/3) = 21.8 years while (J/1,-S/3,+U/4,-N/2) = 55.8 years. Also (S/1,+U/3,-N/4) = 22.0 years, therefore e.g. cos(Ls+3*Lu-4*Ln) oscillates with 11-years period etc.
    J  S  U  N        k*W          M
    ------------------------------------
    0  3  1 -4        11,2       -971,5
    1  0  2 -3        11,1      -1671,2
    2 -3  3 -2        11,1      -5971,4
    0  1  3 -4        22,0       7807,8
    1 -1 -1  1        22,5      -1376,5
    0  1 -1  0        45,4      -1724,2
    1 -2  0  1        44,5      -6717,5
    0  0  2 -2        85,7       2829,8
    0  1 -3  2        96,3      -1072,9
    1 -3  3 -1        82,7       1275,0
Resonance with inclusion of Saturn
Now let us consider resonance with period 44.5 years according to row:
 J  S  U  N        k*W          M
 ------------------------------------
 1 -2  0  1        44,5      -6717,5
After rewriting to the form:
LJ - 2* LS + LN = LJP + k*π/2
we get new values WN (we will compare them to extremes WO):
Spacing     WN     WO
   0,00   1605,503	1605,6
   9,09   1614,593	1613,1
  14,84   1629,433	1627,6
   8,27   1637,701	1638,5
  10,82   1648,516	1649,4
  13,03   1661,548	1660,5
   8,10   1669,652	1671,6
  14,26   1683,917	1682,8
   9,67   1693,582	1694,0
   9,75   1703,329	1705,0
  13,61   1716,936	1716,0
   9,42   1726,355	1727,1
  11,80   1738,155	1738,2
  12,21   1750,366	1749,5
   9,34   1759,702	1760,8
  13,53   1773,228	1772,0
   9,91   1783,139	1783,1
Spacing   WN     WO
   9,75   1792,886	1794,1
  14,35   1807,232	1805,0
   8,19   1815,419	1815,9
  12,70   1828,123	1826,9
  11,14   1839,266	1838,1
   8,27   1847,534	1849,3
  14,59   1862,127	1860,4
   9,25   1871,382	1871,5

  10,16   1881,539	1882,5
  13,28   1894,818	1893,5
   9,34   1904,154	1904,7
  12,54   1916,694	1915,9
  11,47   1928,166	1927,2
   9,75   1937,913	1938,4
  13,61   1951,520	1949,6
   9,58   1961,103	1960,5
Spacing   WN     WO
  10,98   1972,082	1971,4
  13,11   1985,196	1982,4
   8,27   1993,465	1993,4
  14,10   2007,565	2004,6

   9,58   2017,148	2015,7
   8,52   2025,663	2026,8
  14,76   2040,420	2037,9
   8,76   2049,181	2049,0
- Good agreement between the extremes WN and WO exists due to resonance [J/3, -S/8, -U, N/5] (it is derived from the difference of the terms for WN and WO as a function of planetary longitudes...). Leading period of this resonance is (J/3, S/8) = 53.555 years (ie. B/8, divisor of Babylonian period B).
- But - whether all the periods have to be measured relative to Jupiter's perihelion, or to other points (e.g. each planet to its perihelion etc.) - is not clear.
- The values of the spacing (i.e. the distance of two neighboring extremes) appear to be bi-modal, similar to the real solar cycles. But do not correspond to the observed intervals.
Other observations
Significant deviation
Interval of years 1761 - 1805 (with a centre around y. 1783) may be important. There would be solar-activity extremes expected on years marked by # (odd rows), but real activity was observed rather on years marked by asterisks:
Theory      Jp    J    S    U    N    Observation
-------------------------------------------------------
# 1760,65 ***  14  326  358    6  143    1761.5
1765,96      14  136   66   27  154
# 1771,85 ***  14  305  146   51  167    1769.7
1777,08 ***  13  115  211   73  179    1778.4
# 1782,94      13  281  276   98  191
1788,14 ***  13   90  334  122  202    1788.1
# 1793,94      14  256   46  148  215
1799,14      14   63  117  173  226
# 1804,87 ***  15  229  191  200  238    1805.2
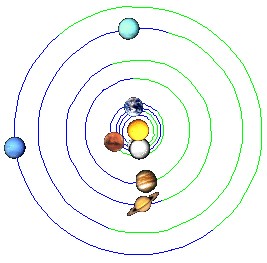
There is certain symmetry or perpendicularity, alignment of outer planets on the year. 1783 (see image of planetary position - Jupiter perihelion is on the right side of the image...!?)